Keep Track of KPIs
Keeping track of Key Performance Indicators (KPIs) help organisations track and monitor progress. It aligns employees’ performance with the long-term strategic goals of the organisation and determines whether you are moving in the right direction.
Start Free Trial Book a Demo
Align Actions & Goals
Align organisational actions and goals. Keep track of goals and actions by continuously analysing KPIs. Organisations can ensure progress by keeping track of trends with all your KPIs.


Monitor Progress
Analyse and monitor KPIs associated with each strategic goal and measure their performance. Organisation will realise where they are now and what needs to be done to achieve the long or short term goals.
Daily, Weekly & Monthly KPIs
Set daily, weekly, and monthly KPIs for better strategy management and execution. The dashboard shows weekly KPIs, Goal versus Actual, Variance, Variance Percentage and responsible person for each KPIs.

Start 14 Days Free Trial
Various business, government, and non-profit organisations use the balanced scorecard to align day-to-day activities with enterprise vision, mission, and values.
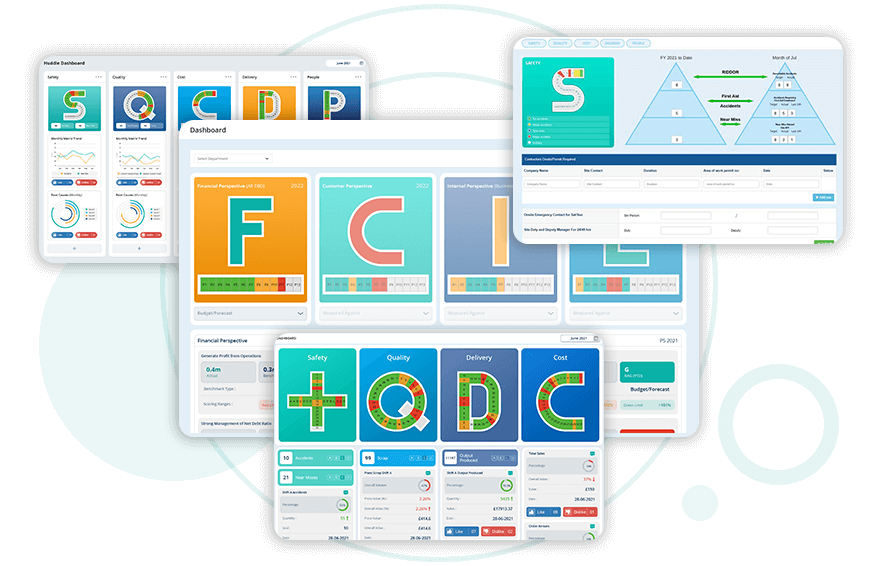
Categorise Relevant KPIs
Organise your KPIs into relevant categories, such as FCIL, SQDCP, SQDC, SQDCL and many more. Navigate and understand different aspects of the organisation's performance. Analyse trends and identify areas of improvement. Establish benchmarks and target values for each KPI. Monitor and compare progress against set objectives. Improve your business performance with informed decisions.
- Visually engaging Dashboards
- Quickly learn trends and variations in performance
- Set up real-time alerts to detect anomalies
- Use historical data to make early warning signs.
- Automate notifications to relevant stakeholders
- Integrate KPIs into daily management practices for proactive decision-making.
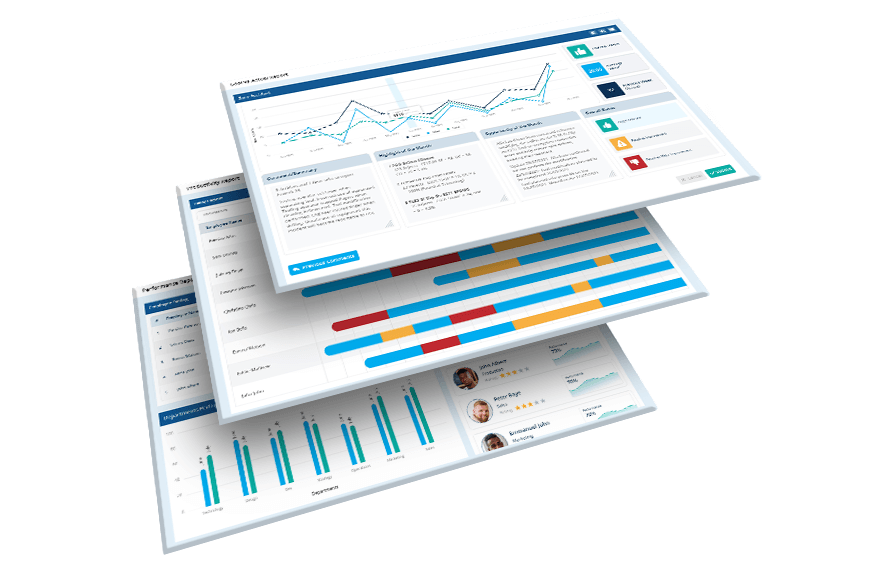
KPI Reports
Generate and disseminate comprehensive KPI reports directly. Users can effortlessly create KPI reports with just a few clicks. Customise KPI reports by selecting specific KPIs, date ranges, visualisation formats, and other relevant parameters. Share generated KPI reports with relevant team members or stakeholders, fostering collaboration and facilitating discussions around performance metrics.
Contents
- What is meant by KPI?
- What is the difference between a KPI and a metric?
- What are the common types of KPIs?
- What are KPI dashboards?
- What is KPI tracking, and why do businesses track it?
- What is the importance of KPI reports?
- Do you need a dedicated KPI tracking software?
- How do you transform your sales objectives into KPIs?
- How can you choose the right KPIs for your business?
- How can KPI visualisation help for better understanding and analysis?
- Are KPIs applicable to all organisations and industries?
- How often should KPIs be reviewed and updated?
What is meant by KPI?
KPI stands for Key Performance Indicator. It is a measurable value that helps organisations evaluate their success in achieving specific objectives. KPIs vary depending on the goals and nature of the business, but they should be clear, specific, and directly tied to critical success factors. A well-defined KPI provides a quantitative measure of performance and helps monitor progress, make informed decisions, and drive improvements in the organisation's overall performance. Examples of KPIs include revenue growth rate, Customer Satisfaction Score (CSAT), Employee Turnover Rate (ETR), and more.
5 easy steps in creating a KPI involves :
- Define objectives: Clearly articulate the specific goals you want to achieve with your KPIs. These objectives should be aligned with your organisation's overall strategy and mission.
- Identify critical success factors: Determine the key factors directly contributing to achieving the objectives. These factors should be measurable and significantly impact your organisation's success.
- Set measurable targets: Establish quantifiable targets for each KPI. These targets should be Specific, Measurable, Achievable, Relevant, and Time-Bound (SMART) to provide a clear sense of progress and success.
- Choose relevant metrics: Select the appropriate metrics to track and measure the critical success factors. Ensure that the data required for these metrics is readily available and reliable.
- Monitor and analyse: Monitor and analyse the KPIs to assess performance and progress toward the set targets. Regularly review the results, identify trends, and take necessary actions to improve performance and achieve your objectives.
Calculating KPIs involves using simple mathematical formulas based on selected metrics. For instance,
Start-of-Period Customers
More complex KPIs like profitability or Return on Investment (ROI) require specific formulas. Utilising tools like Balanced Scorecard (BSC) software streamlines data collection and provides a comprehensive performance overview across Financial, Customer, Internal processes, and Learning & growth (FCIL)
What is the difference between a KPI and a metric?
The main difference between a KPI (Key Performance Indicator) and a metric is its purpose and relevance. A metric is a measurement providing information about a specific performance aspect. It can be any data value, such as revenue or Customer Satisfaction Score (CSAT). On the other hand, a KPI is a specific metric selected and used to evaluate the progress toward achieving critical business objectives. KPIs are carefully chosen because they directly correlate to the success of the organisation's strategic goals, whereas metrics provide broader performance insights without necessarily being tied to strategic outcomes. In essence, KPIs are a subset of metrics with strategic significance.
What are the common types of KPIs?
- Financial KPIs: Measure an organisation's financial performance, such as revenue growth, profit margins, and Return On Investment (ROI). They help assess financial health and profitability.
- Customer KPIs: Evaluate customer satisfaction, Customer Retention Rate (CRR), and Net Promoter Score (NPS). These KPIs gauge customer loyalty and the effectiveness of customer service efforts.
- Operational KPIs: Track operational efficiency, productivity, and process performance. Examples include Production Cycle Time, Inventory Turnover, and employee productivity.
- Sales and Marketing KPIs: Assess sales performance, lead generation, conversion rates, and marketing ROI. These KPIs help optimise sales and marketing strategies.
- Employee KPIs: Measure Employee Engagement, Turnover Rate, and Performance Metrics. They aid in talent management and workforce optimisation.
- Quality KPIs: Monitor product or service quality, defect rates, and customer complaints. These KPIs highlight areas for improvement and ensure consistent quality.
- Health and Safety KPIs: Track workplace accidents, incidents, and compliance with safety regulations. They promote a safe work environment and employee well-being.
These KPIs provide valuable insights into different aspects of an organisation's performance, enabling data-driven decision-making and continuous improvement across various departments.
What are KPI dashboards?
KPI dashboards are visual tools that display Key Performance Indicators (KPIs) and other relevant metrics in a centralised and easily understandable format. These dashboards provide real-time, data-driven insights into an organisation's performance, allowing stakeholders to track progress, identify trends, and make informed decisions. KPI dashboards typically use graphs and other data visualisations to present complex information clearly and concisely, making it easier for users to interpret and act on the data. They are a powerful tool for businesses to monitor performance, foster transparency, and align teams towards achieving strategic objectives.
What is KPI tracking, and why do businesses track it?
KPI tracking involves monitoring and measuring Key Performance Indicators regularly to evaluate an organisation's progress toward achieving its strategic objectives. Businesses track KPIs to gain valuable insights into their performance, identify strengths and weaknesses, and make data-driven decisions for improvement. By monitoring KPIs on a dashboard, businesses can visualise their performance metrics in a centralised, easily digestible format. This enables real-time monitoring, quick identification of trends and patterns, and the ability to take prompt corrective actions. A KPI dashboard streamlines communication, fosters accountability and facilitates a better understanding of overall performance, ultimately leading to more efficient and effective decision-making processes.
What is the importance of KPI reports?
A KPI report is a document or presentation that provides a detailed analysis and summary of Key Performance Indicators (KPIs) and their performance over a specific period. It presents data clearly and concisely, highlighting trends, progress, and areas that require attention. The importance of KPI reports lies in their ability to offer valuable insights into an organisation's performance, helping stakeholders make data-driven decisions, identify strengths and weaknesses, and take appropriate actions to achieve strategic goals. KPI reports foster accountability, communication, and continuous improvement, ultimately contributing to the overall success and growth of the business.
Do you need a dedicated KPI tracking software?
Using KPI tracking software can greatly simplify the process of monitoring and reporting, as it centralises data, automates updates, and provides interactive dashboards. This ultimately boosts the efficiency and effectiveness of KPI management.Implementing a Balanced Scorecard for monitoring and tracking KPIs offers several benefits, including aligning business activities with strategic goals, providing a comprehensive view of performance across different perspectives (Financial, Customer, Internal processes, and Learning & growth [FCIL]), fostering communication and collaboration among teams, and enabling data-driven decision-making.
How do you transform your sales objectives into KPIs?
To create KPIs from sales objectives, define specific and measurable sales goals and identify critical success factors. Convert these factors into KPIs with measurable targets for tracking performance. For aligning individual goals with organisational objectives, cascade strategic KPIs to each level of the organisation and translate them into specific targets for teams and employees. Linking individual performance to KPIs provides clarity, motivation, and a sense of ownership in driving organisational success.
How can you choose the right KPIs for your business?
To choose the right KPIs for your business, follow these steps:
- Define your business objectives and strategy.
- Identify critical success factors that directly impact those objectives.
- Select KPIs that measure those success factors and align with your business goals.
- Ensure the KPIs are Specific, Measurable, Achievable, Relevant, and Time-bound (SMART).
- Consider data availability and reliability for easy tracking.
- Regularly review and update KPIs to stay relevant to your evolving business needs.
How can KPI visualisation help for better understanding and analysis?
In a visual format, KPI visualisation facilitates understanding and analysis of complex data. Dashboards make it easier to identify trends, patterns, and outliers at a glance. Visual representation allows for quick comparisons and helps stakeholders better understand performance insights. Visualising KPIs also fosters better data-driven decision-making, simplifying the communication of critical information and supporting a deeper understanding of key metrics and their relationships.
Are KPIs applicable to all organisations and industries?
Key Performance Indicators (KPIs) are relevant to all businesses and industries since they can be customised to fit specific goals and crucial success factors. An effective KPI is specific, measurable and aligned with organisational goals, relevant to performance, and time-bound (SMART). KPIs drive continuous improvement by providing regular performance insights, highlighting areas for enhancement, and enabling data-driven decision-making. By monitoring and analysing KPIs, organisations can identify improvement opportunities, set growth targets, and track progress over time, leading to better overall performance and success.
How often should KPIs be reviewed and updated?
The frequency of reviewing and updating KPIs depends on the nature of the organisation, the KPIs themselves, and the pace of change in the business environment. KPIs should be reviewed regularly to ensure they remain relevant and aligned with the organisation's objectives and strategies. A common practice is to conduct quarterly or monthly reviews, but some organisations may choose to do it weekly or annually. It is essential to strike a balance between frequent reviews to stay agile and adapt to changes and infrequent reviews to allow sufficient time to collect meaningful data and assess long-term trends. Ultimately, the key is to have a flexible approach that aligns with the specific needs and dynamics of the organisation.
Other Datapoint Features

Interactive Dashboards
Users can access multiple interactive dashboards to get meaningful insights regarding the businesses.
Read More
Keep Track of KPIs
Analyse and monitor KPIs associated with each strategic goal and measure their performance.
Read More
Mobility & Global Accessibility
Gain access over multiple devices. Translate strategy plans into actions with much ease.
Read More
Dynamic Report
Automated dynamic reports give meaningful insight. Save time and visualise growth.
Read More
MES & ERP Integration
Easily integrate online Balanced Scorecard system with ERP and gain multiple benefits.
Read More
Hoshin Kanri X Matrix
X Matrix to initiate action plans and drive continuous improvement across the organisation.
Read More


Request Your
1-Month FREE Trial!
Use Digital Balanced Scorecard to achieve the organisation’s strategic goals.
Start Free Trial